|
||||||||
|
|
||||||||
|
Urban Environmental Geography LECTURE NOTES – February 1, 2010 TOPICS: Chapter 4: Circulation of the Oceans and Atmosphere… effects on cities And Chapter 5: Atmospheric Water and Weather… effects on cities
Announcements: the plan… lecture today.
How does before and after class on Wednesdays work for extra coaching? Assume extra coaching after… email me if you want coaching before… sometimes it’s not possible for me to get to class early… but I can almost always stay after.
Feedback... there's too much grief associated with completing every question of the labs. Google Earth is a terrific tool and you'll master it. With respect to the workbook... look to the revised HW05 criteria... clarified that it is the application of the lab that matters the most and indicating how much of the lab means total completion. Homework in general has an initial part on skills (the workbook labs, or the inclass exercise) and a part where you apply skills and concepts to your urban setting. The assessment weight is 1/3 for the labs and 2/3 for the application.
LabLeadership – the plan – HW02 LabLeadership – the forms – LINK in .doc format LINK LabLeadership – sample Green Sheet LINK I’ll return homework on Wednesdays.
To connect to UofU Blackboard… http://webct.utah.edu Log in, go to GEOG3330 (the sections should be crosslisted, so no problem if you’re in ENVST3330 Go to Lecture Notes… and the powerpoints should be there.
LECTURE … content Today, I’ll take time to make sure that the concept of… given the same mass … a hotter mass is less dense and it will tend to rise. Less dense also means less pressure for the same volume.
Reminder: ENERGY as a BIG concept of science. Heat is a form of energy (thermal energy) EARTH SYSTEMS: The uneven distribution of heat drives plate tectonics and circulation of oceans. Directly, or indirectly, the uneven distribution of energy/heat in the geosphere (tectonics), hydrosphere (circulation of oceans), atmosphere (weather and climate), biosphere… (trophic levels, plants… animals), and anthrosphere (politics of energy resources), influences urban settings and urbanization.
Review and revisit: CONCEPTS from Chapters 2 and 3.
CONCEPTS of Chapters 4 and 5. … Some of this may be covered again by Wednesday’s presenters. I’m going to explain why air masses of different densities rise and fall. POWER POINT Chapter 4 on the one screen, find them at WebCT… notes on the other screen, find them on the course website.
Notes: go to course web site (www.earthscienceeducation.org ) Chapter 3 – Figure 3.11 LINK incoming radiation … energy budget by latitude Chapter 4: Atmospheric and oceanic circulation. Pressure = mass / square unit of surface area The atmosphere has mass… not much but works well for us. Air pressure can be measured by an instrument called a barometer. Hence the term, barometric pressure. Atmospheric pressure is your friend. You breathe because of air pressure outside your lungs. differences. Wind is the movement of air driven by pressure differences. Pressure differences of the atmosphere are largely due to differences in density.
BIG CONCEPT: The Gas Law. (P)(V) = N(constant)(T) Pressure * Volume = Number of atoms, meaning mass * R, meaning the gas constant * TemperatureThink of a pressure cooker… or a boiler. P = pressure (a force per unit area); barometric pressure measures the weight of the column of air being held up by an area of Earth's surface (such as your head). When people goes up an elevator of a skyscraper and their ears pop... what is happening? V = volume N = number of atoms . or mass R = gas constant T = temperature
Mass / Volume = Density
Pressure = density * gas constant * temperature
During the day. solar energy increases the temperature of the air. Volume ... when volume expands, pressure decreases assuming temperature stays constant. Temperature ... when temperature increases … either pressure increases or volume increases. Pressure... when pressure decreases... temperature decreases
DENSITY affects pressure: the same mass of less dense material exerts less barometric pressure at a recording station below it. THICKNESS of layers of differing densities affects barometric pressure: A series of thick units of relatively dense air exerts more barometric pressure on Earth's surface than a series of thinner units. TEMPERATURE affects density: hot air rises because it is less dense and denser air displaces it. OTHER conditions affect density, such as moisture content... but their effects are much less than the uneven distribution of heat. UNEVEN Distribution of heat, uneven distribution of temperatures of air masses. From last time…
GA… draw how this works. Example, hot air balloon.
Wind Circulation… and ocean circulation, too It’s all about … Temperature... density... pressure
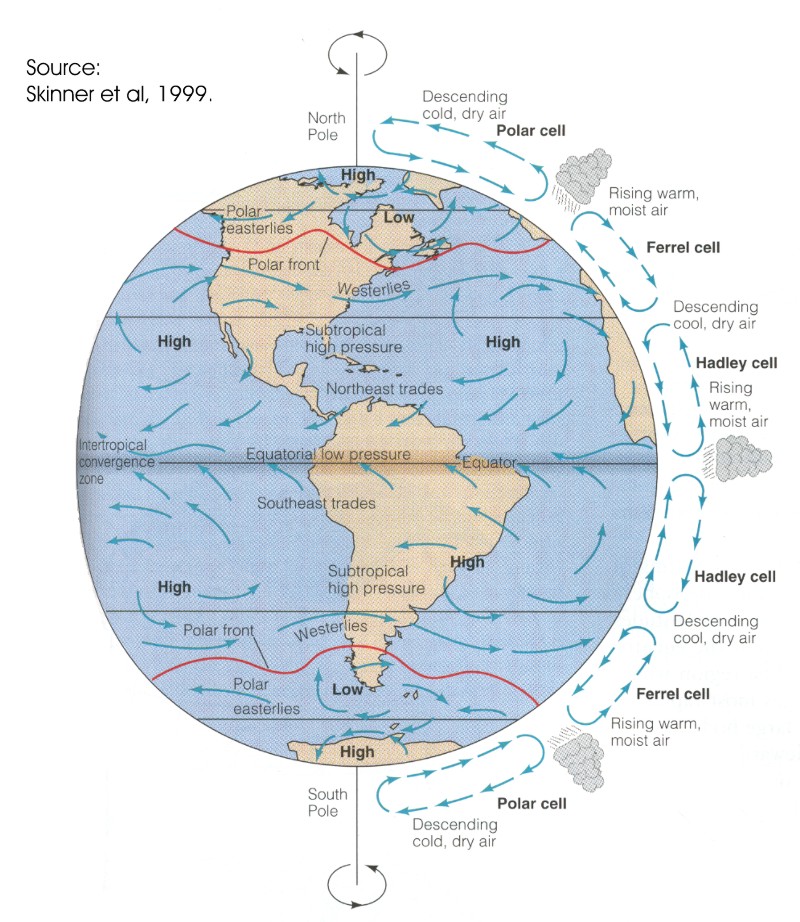
Layered atmosphere and pressure Pressure systems: high pressure systems versus low pressure systems LINK SkinnerGlobalCells
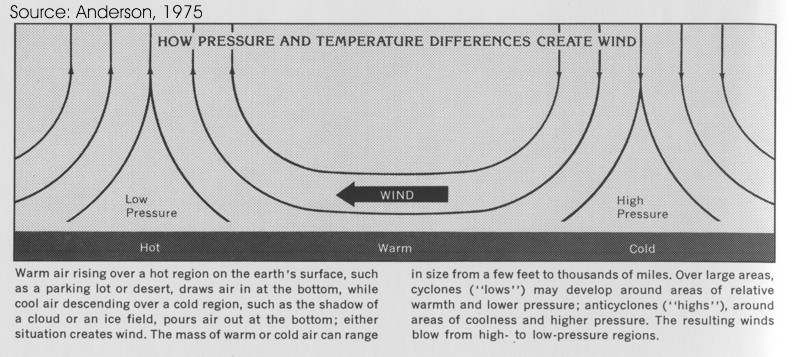
Wind is air movement from a region of higher pressure to areas of lower pressure. LINK. AndersonWindHiLow Scale:
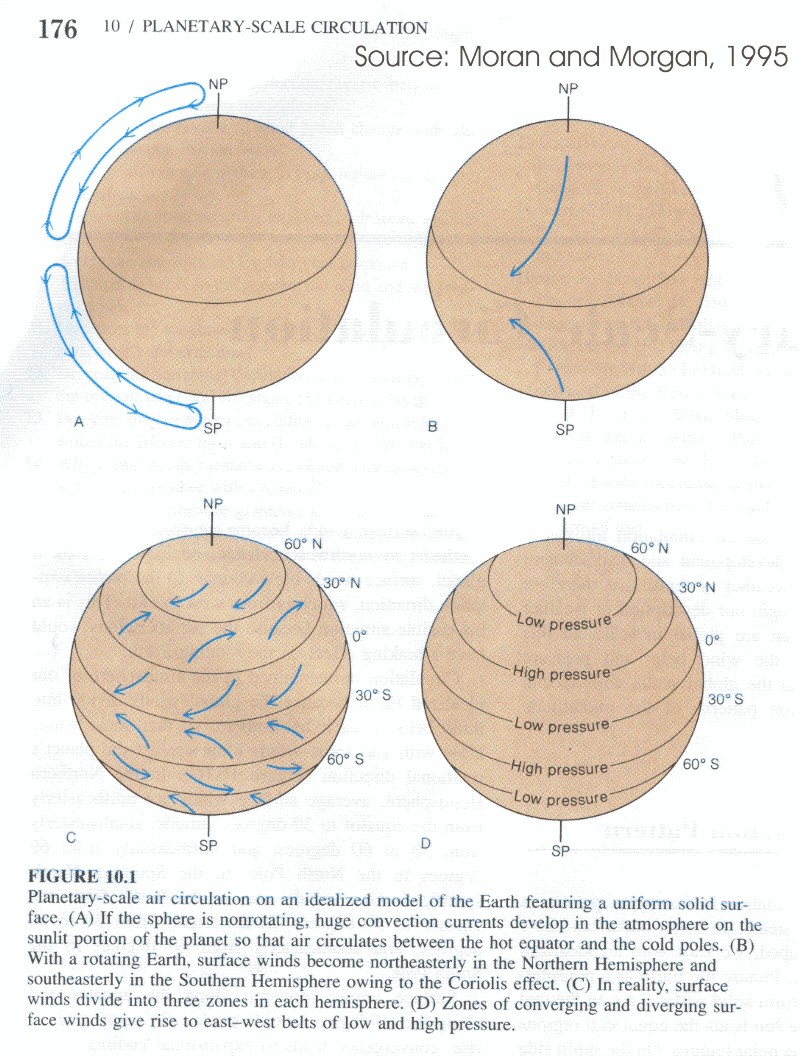
GLOBAL: Planetary winds. LINK. MandM-PlanetaryCirc
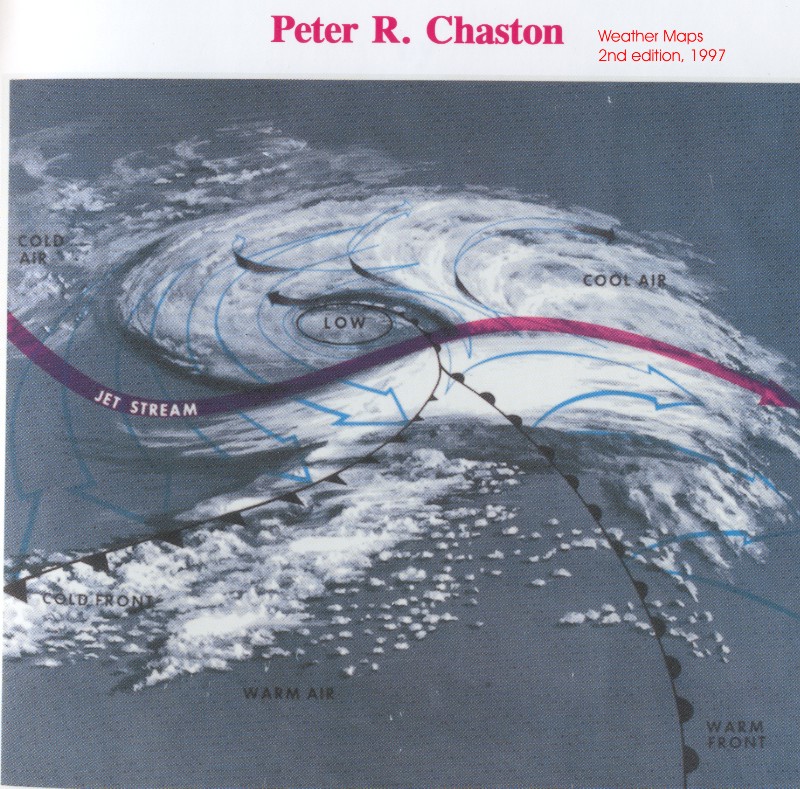
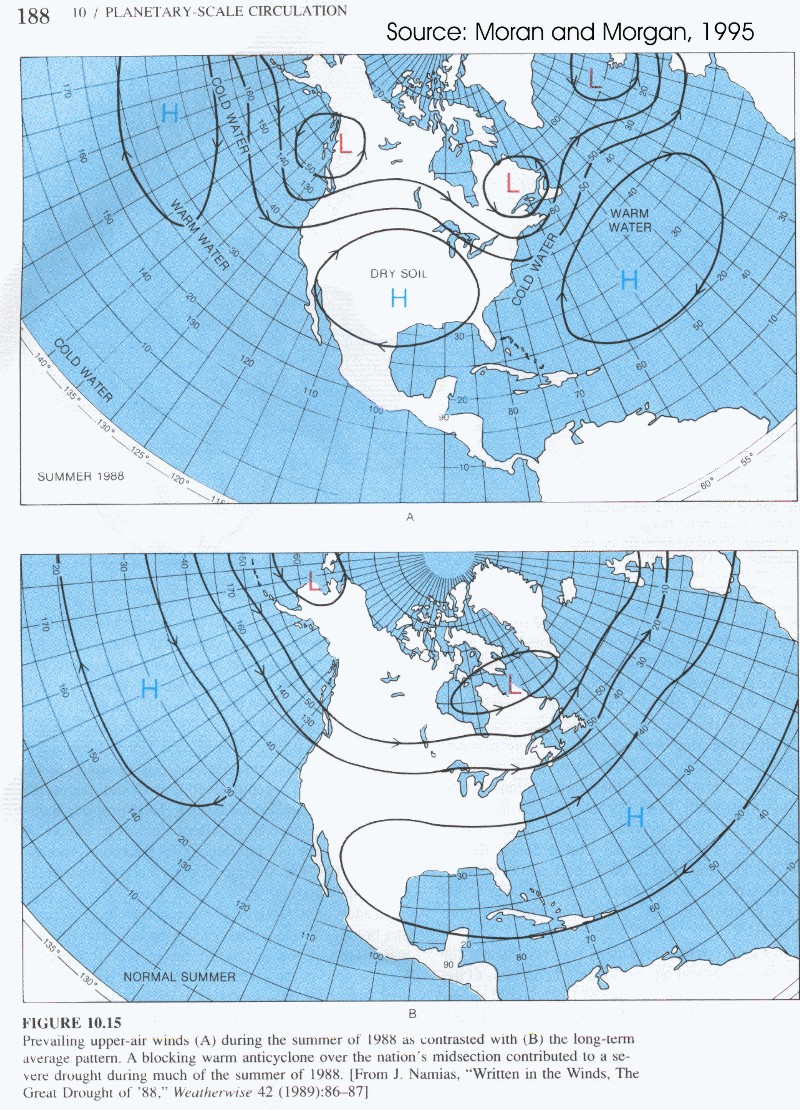
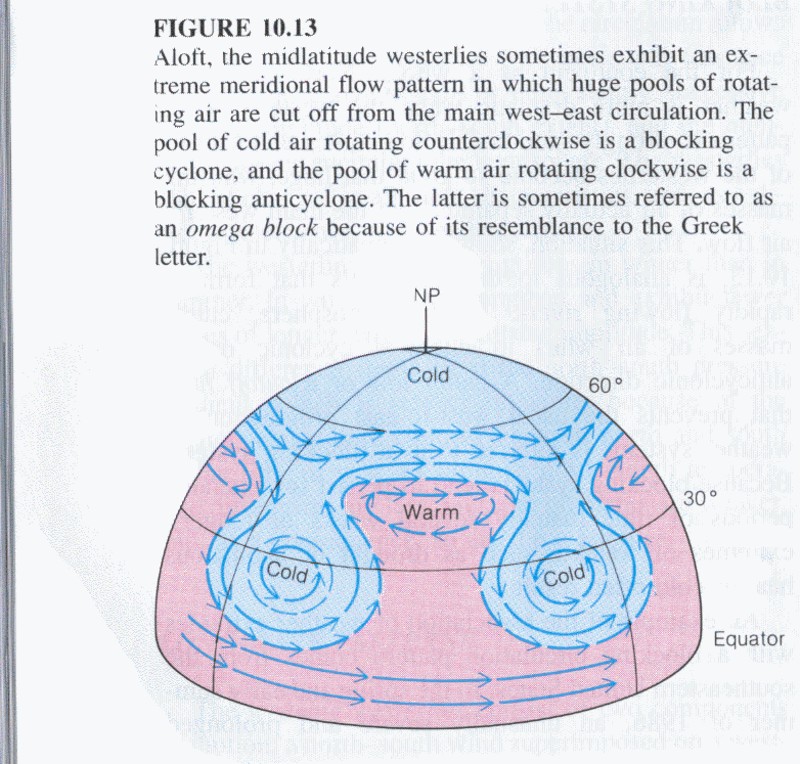
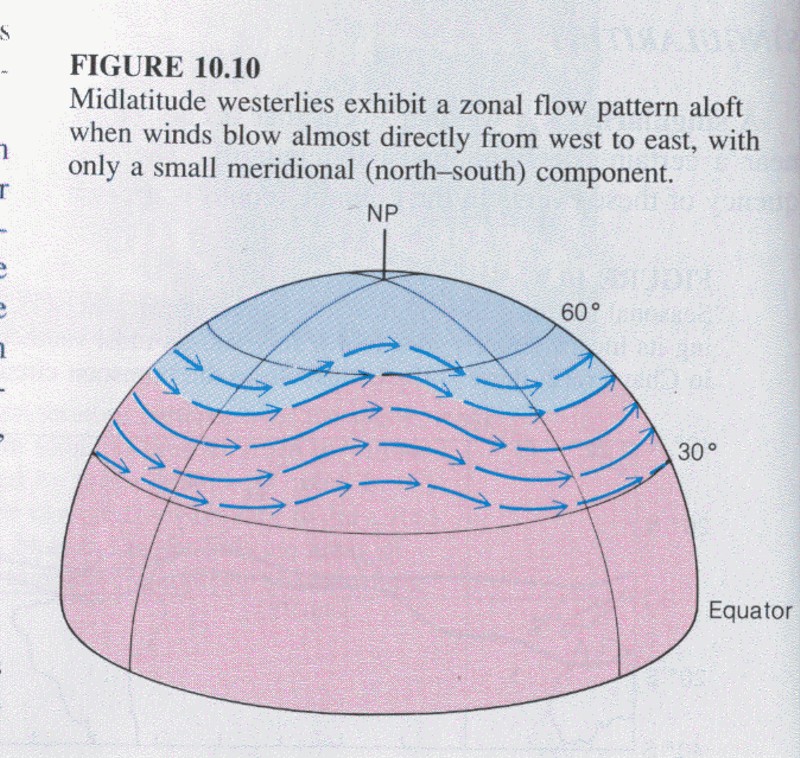
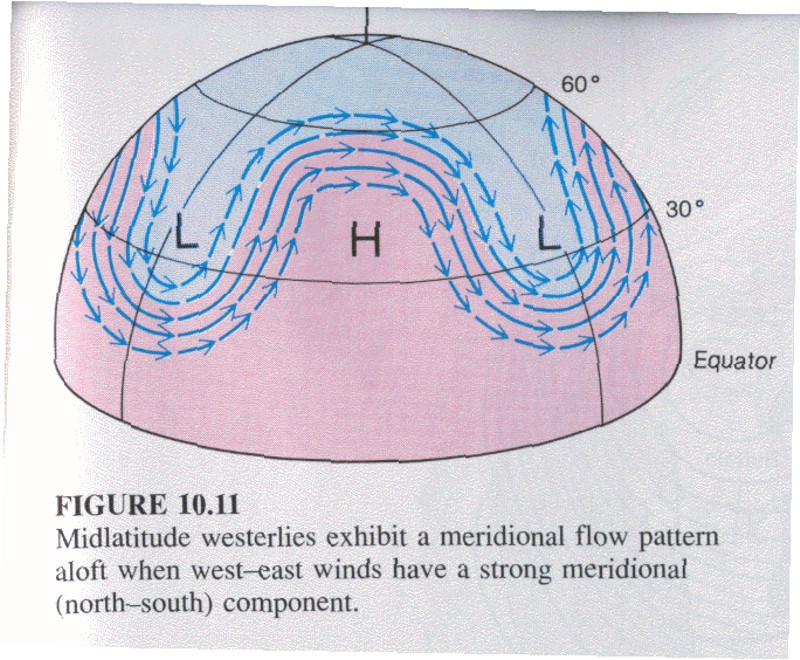
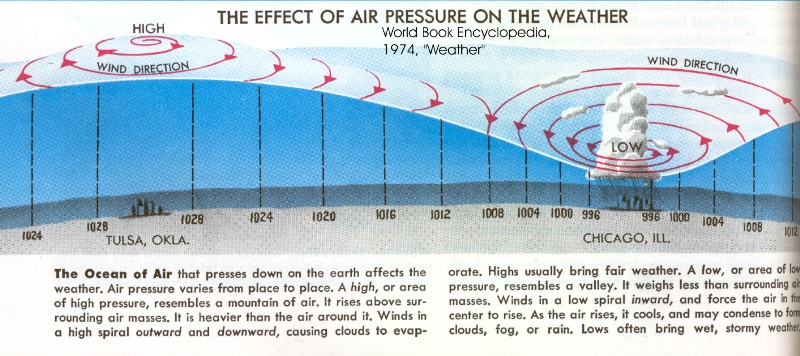
REGIONAL: Synoptic (bigger than a country, smaller than a continent) scale systems (high and low pressure systems) are associated with cyclonic and anticyclonic winds... driven by low pressure systems (cyclonic) and high pressure systems (anticyclonic). LINK ChastonCvr Synoptic scale pressure systems have seasonality. LINK -MandM-SummerHiLow Sometimes synoptic scale systems get "blocked" LINK MandM-BlockedFlow The resulting patters are sometimes more loopy than other times: smoothe west to east patterns are called zonal. LINK MandM-Zonal and loopy patterns are called meridianal LINK MandM-Meridional . The seasonality of these patterns matters to urban environmental geographers because it affect weather (quality of life) and predictability of weather. What do high and low pressure systems look like in three dimensions? LINK WorldBookContourPressures note the contours... what do the contours represent?
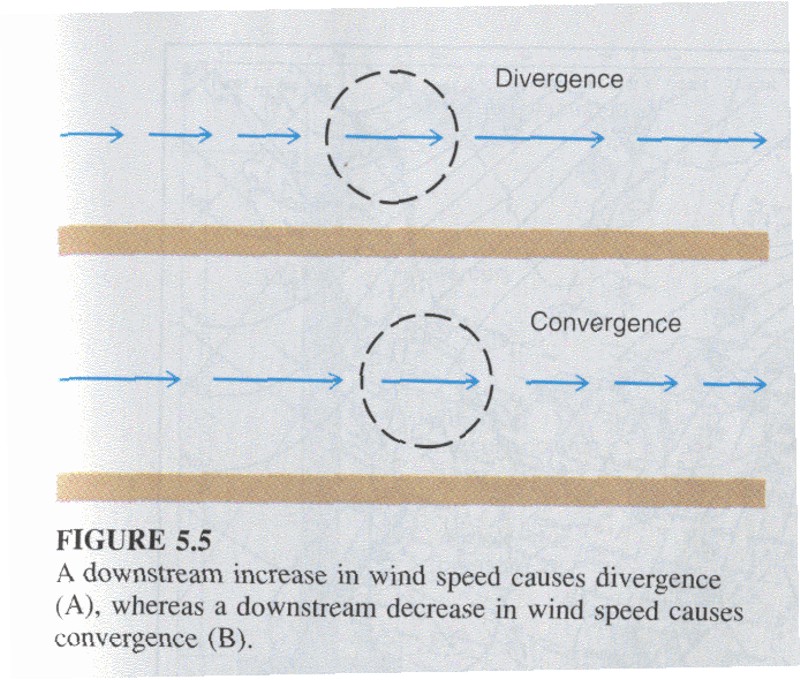
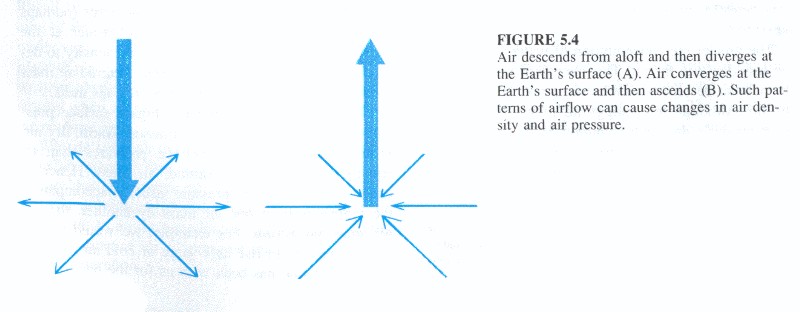
LOCAL SCALE = TERRAIN related: Divergence means to pull apart, to separate farther: winds can diverge horizontally LINK MandM-ConvergeDiverge or LINK vertically MandM-Diverge Remember THE GAS LAW of earlier today? When a gas contracts, it becomes....Terrain affects divergence and changes local conditions, and this explains some types of cloud formation. Temperature differences cause on- and off-shore winds.
CHAPTER 5. Atmospheric Water and Weather. Water is pretty amazing… Earth… is really the Water Planet
THE HYDROSPHERE. Systems have subsystems. Systems have feedback loops. Subsystems are dynamic. They inter-relate. It's a loopy world.
WATER'S WONDROUS QUALITIES. WebLink to USGS education site LINK to that page Water and life Water an exception solute. Water. It's peculiar. As it approaches freezing it expands! and changes density, and ice floats. Water's greatest density is at 39 degrees F. (4 degrees C). Melting... freezing... condensation... evaporation... Phase changes. Christopherson... image. Fig 5.4..
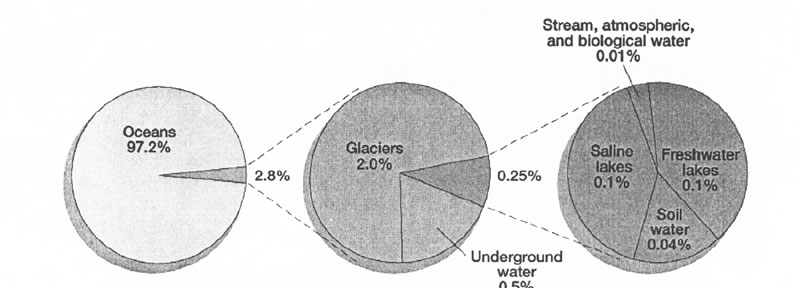
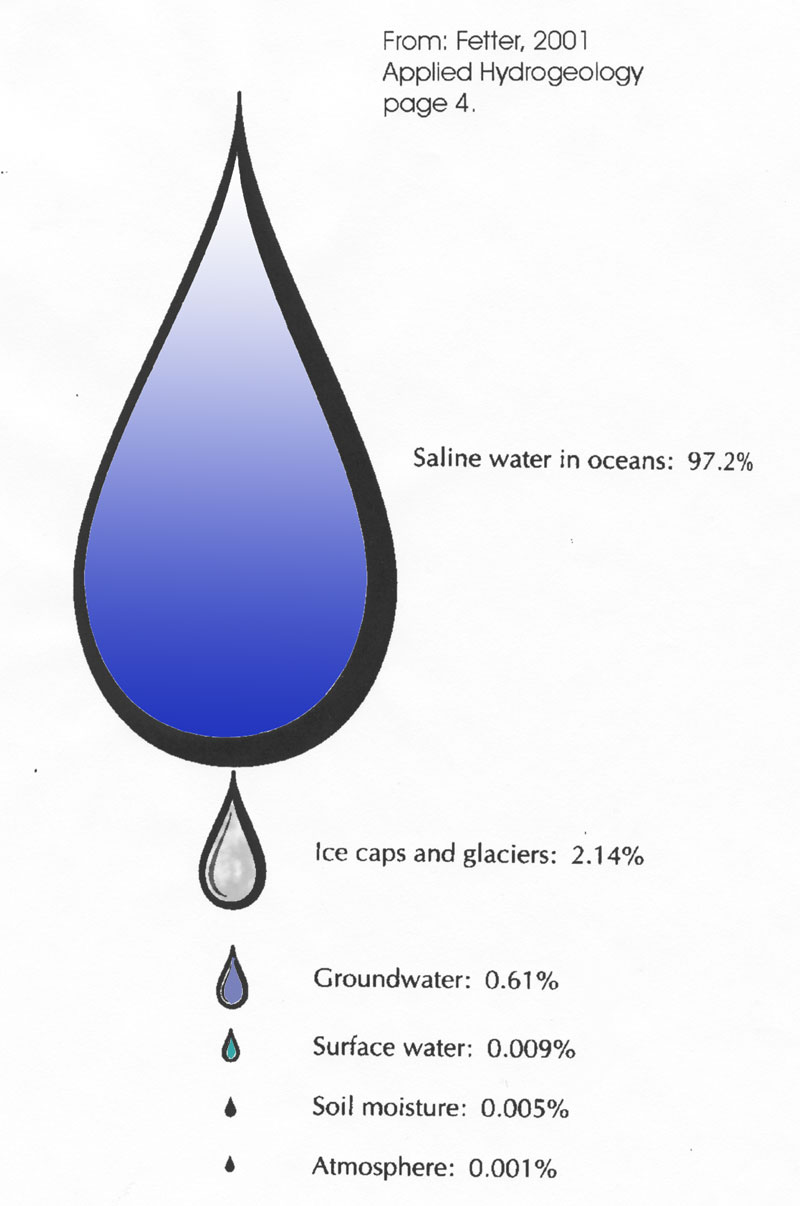
WATER ON EARTH "Minor" reservoirs are major factors for human beings and urban environments LINK to MacKenzie, 2003. Table 4.1 LINK to Fetter's "drop version" H2O abundance
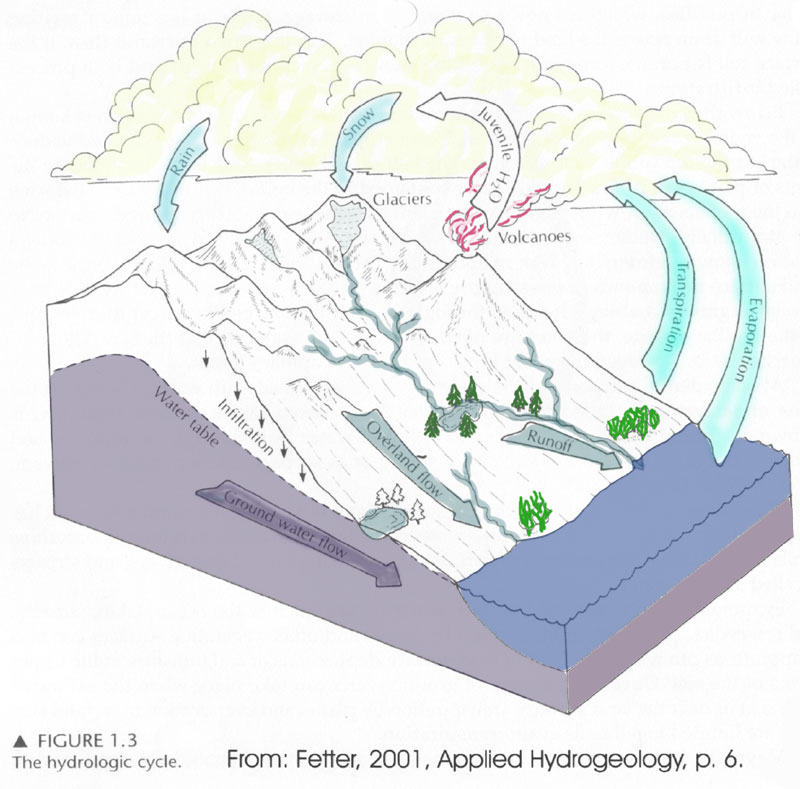
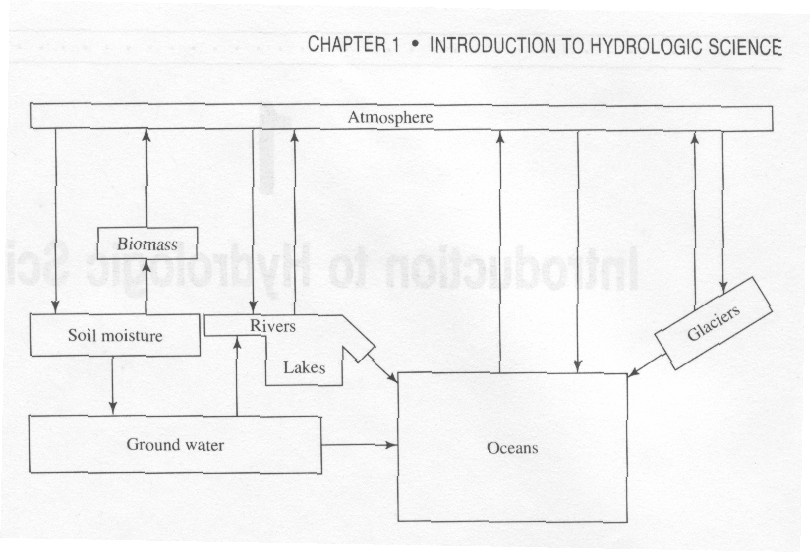
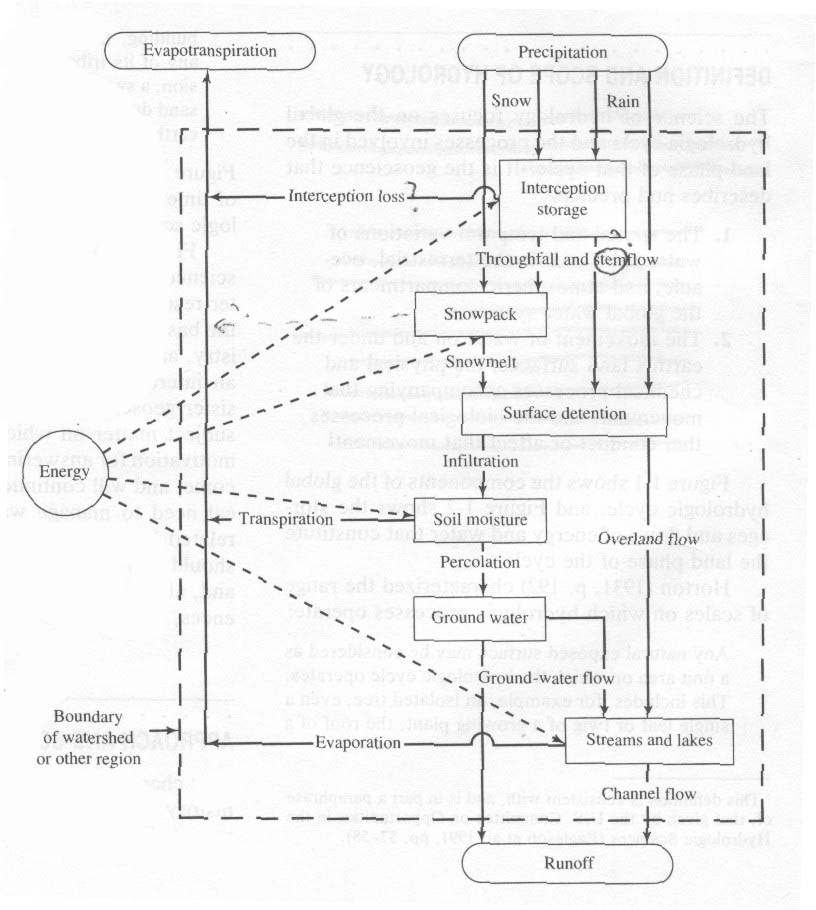
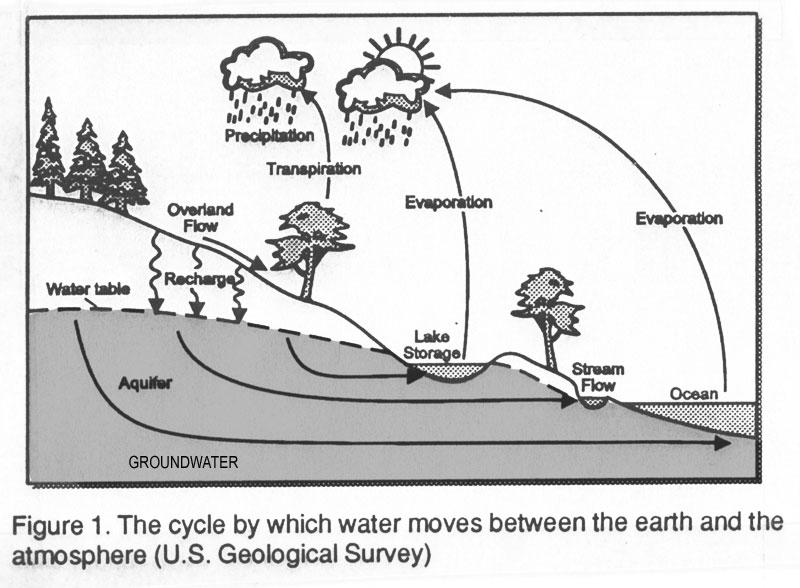
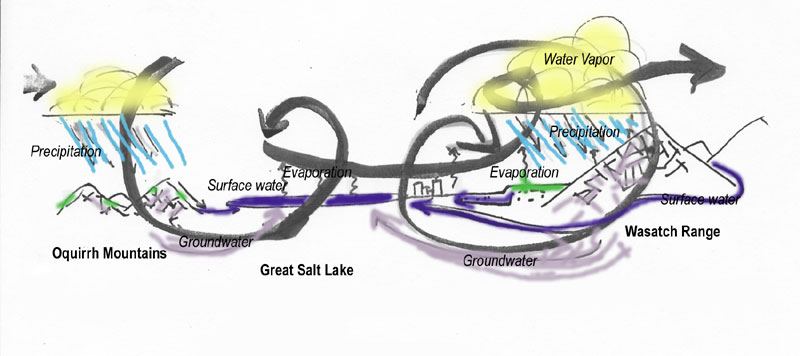
THE WATER CYCLE LINK to Fetter's version LINK to Dingman's box model and LINK to more complex LINK expanded box model LINK to USGS version; and in USGS-WaterCycleInColor LINK LINK to ESE version for SLCounty |
||||||||
|
{Students of Geog/Envst3330 -- for powerpoints of lectures, go to your UofU WebCT / Blackboard course files } {Problems viewing this site? Please contact genevieve.atwood@geog.utah.edu} {This page modified on January 2010- Modifications will continue through Spring semester 2010} |
||||||||
